Current Research

Simulating AGN disk structure and X-ray reprocessing
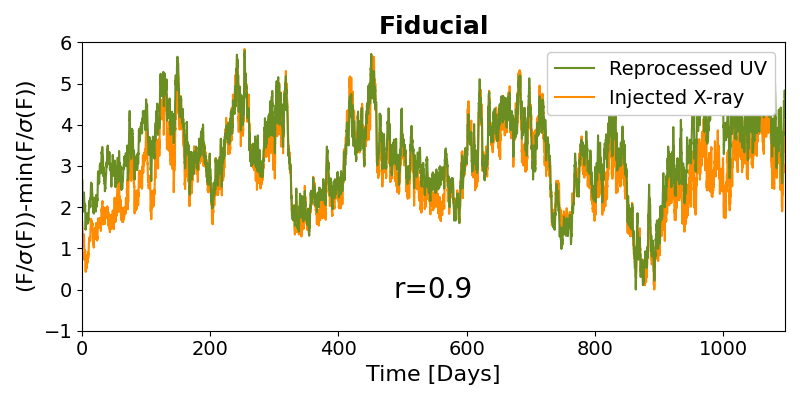
Reverberation mapping uses echoes between variability in AGN light curves observed in different wavebands to measure the radial temperature profile and radial extent of AGN disks. However, the current “lamp-post” model for reverberation mapping is oversimplified and fails to describe all of the variability found in UV-optical light curves. I use a new multi-frequency implicit radiation scheme (Jiang, 2022) in the magnetohydrodynamic (MHD) code Athena++ to simulate the reprocessing of X-ray light by the UV- and optical-emitting regions of AGN disks.
- In Secunda et al (2024), I show that because the absorption opacity at the surface of AGN disks is low, X-ray irradiation is scattered by the disk and the correlation between the incident X-ray and emitted UV-optical flux will be low. This result does not agree with the typically assumed model for reverberation mapping, which says X-ray variability is the main driver of variability in UV and optical light curves emitted by an AGN disk. However, it does agree with recent observations that find that the X-ray and UV-optical light curves are less well-correlated than expected (e.g., Edelson et al., 2019).
- In Secunda et al. (2025), we perform another suite of multi-frequency radiation MHD simulations using an updated opacity model for the X-ray radiation to show that with sufficient X-ray luminosity and a lower albedo it is possible to have highly-correlated X-ray and UV light curves. In our simulations, the reprocessing of X-ray irradiation into UV emission is nearly instantaneous, as is often assumed, however linear reprocessing models fail to fully capture X-ray reprocessing. We also show that the X-rays in our simulations heat the disk increasing the temperature by a factor of 2-5 in the optically thin region, which could help explain the larger than anticipated lags measured in several reverberation mapping campaigns.

Searching for variability in Little Red Dots
JWST observations have uncovered a new population of red, compact objects at high redshifts, called Little Red Dots (LRDs). Because of their compactness and frequent association with broad emission lines, LRDs are thought to be AGN. However, several other features of these LRDs, such as a lack of X-ray emission, cast doubt on this AGN explanation. In particular, multi-epoch observations of AGN lack evidence of the variability that would be expected in AGN light curves. I use empirically and theoretically modeled mock light curves to determine the probability of detecting significant variability larger than anticipated observational errors given the low numbers of epochs for LRDs observed with JWST.
- In Furtak, Secunda et al. (2025), I made mock light curves of the AGN A2744-QSO1 which, due to lensing-induced time delays between three images, has roughly ten observations spanning almost 3 years in the rest frame. We find that because of the large lensing induced magnitude errors it is difficult to detect significant variability in these mock light curves, making us unable to rule out that A2744-QSO1 is varying.
- In Secunda et al. (2026a), we find that even though most LRDs have only been observed 2–4 times in a given waveband, we should still be detecting significantly more variability if traditional sub-Eddington AGN variability models can be applied to LRDs. In addition, the ongoing high-cadence NEXUS campaign will detect changes in magnitude, ∆m > 1, for traditional sub-Eddington models. On the other hand, we find our models for super-Eddington AGN variability are consistent with the ongoing non-detection of variability for a majority of sources. Even if LRDs lack continuum variability, we find that the spectroscopic JWST campaign TWINKLE should observe broad emission line variability as long as soft X-ray irradiation manages to reach the broad line region from the inner disk.
Finding negative lags on the viscous timescale
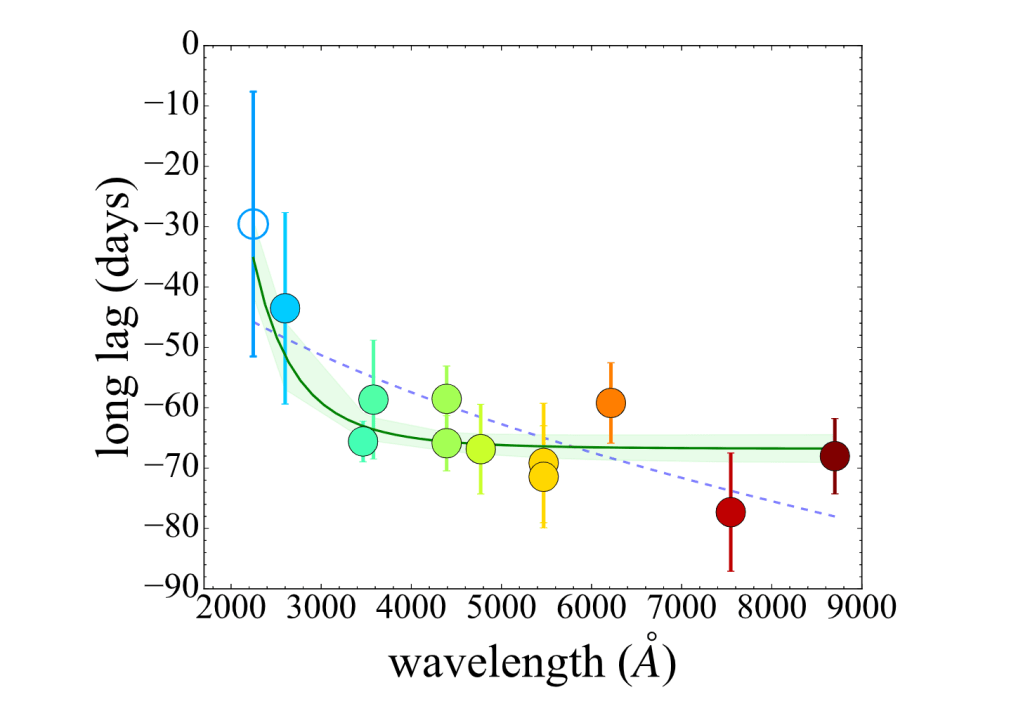
I use SWIFT and other archival quasar light curves to search for “long negative” lags, where the variability in high frequency bands lags the corresponding variability at low frequency, as a probe of accretion disk structure. Traditional reverberation mapping uses lags of variations in active galactic nuclei (AGN) photometry from high frequency to low frequency wavebands on the light-crossing timescale, which come from the reprocessing of light in different temperature regions of the disk. The long negative lag, on the other hand, is due to fluctuations in the outer part of the UV/optical region of the disk that are accreted inward on the inflow timescale. Because the inflow rate also depends on disk properties, unlike the speed of light, these long lags can provide additional information about disk structure. Standard disk models predict the inflow timescale is on the order of hundreds of years. However, recent 3D radiation magnetohydrodynamic simulations of AGN disks suggest that in the UV/optical region of the disk, the inflow timescale can be on the order of only 100 days, not years. In Yao, Secunda, et al. (2023) we make the first robust detection of a long lag. We find a long lag of around -70 days between several optical bands and the W2 band in the SWIFT and LCO light curves from Hernandez-Santiseban et al (2020).

Preparing for Vera Rubin
The long baseline and high cadence of the Vera Rubin Observatory’s Legacy Survey of Space and Time (LSST), will be ideal for detecting more long negative lags. In Secunda et al. (2023b), I evaluate different proposed cadence options for LSST to determine which cadences work best for detecting these lags. I also test various lag detection methods developed for finding disk continuum and Broad Line Region reverberation mapping on mock LSST light curves in order to have the most effective software in hand once light curves from LSST become available. We find that even with conservative estimates, LSST has the potential to detect dozens to hundreds of additional long lags.
I recently developed a machine learning model with a transformer-based architecture to detect long negative lags in LSST light curves (Secunda et al. 2026b). This model is 98% accurate on mock light curves with anticipated LSST cadences and errors, which is a significant improvement over the methods tested in Secunda et al. (2023b).
I am also the co-coordinator of the LSST AGN Variability Subgroup where I am co-leading a reverberation mapping code challenge.
Previous Research
AGN Disk LIGO Merger Channel
I developed the first N-body code to simulate the effects of gas torques, eccentricity and inclination dampening, and stochastic turbulent torques on black holes (BHs) orbiting in an AGN disk, to study the formation of stellar mass binary hole binaries (BBHs). In particular, I have focused on the region in an AGN disk surrounding the “migration trap,” or a radius in the disk where inward and outward gas torques can cancel out. I have several papers on this subject:
- Secunda et al. (2019): Gas torques on orbiters in an AGN disk lead to rapid migration resulting in a majority of orbiters forming binaries on timescale much shorter than the disk lifetime
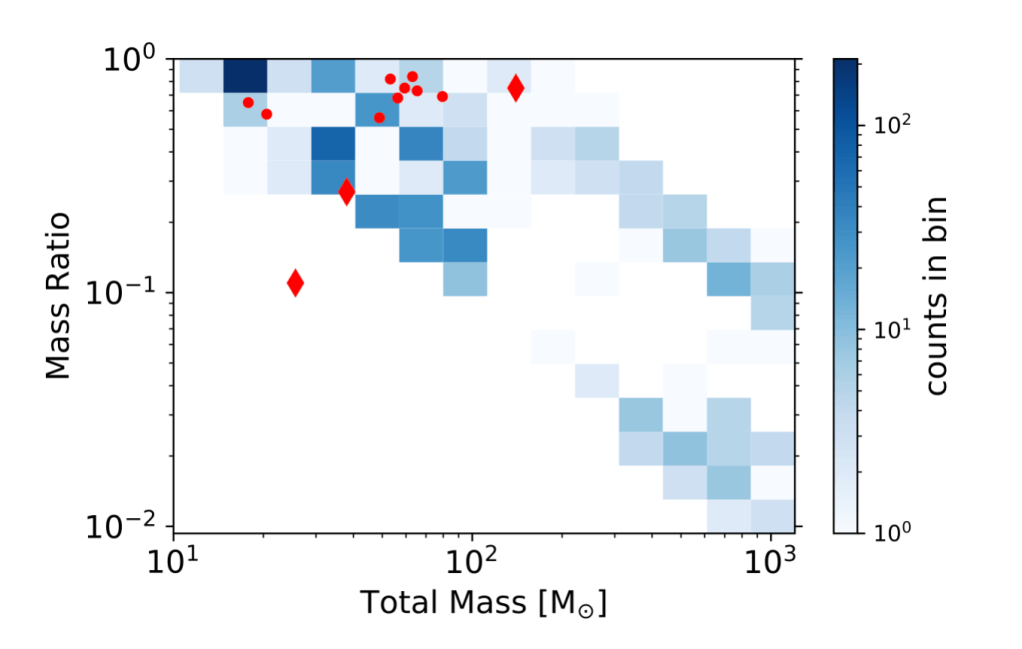
- Secunda et al. (2020a): Migration in regions around the migration trap naturally lead to hierarchical growth and uneven mass ratio binaries at rates similar to those predicted by LIGO-Virgo-KAGRA (LVK). Our simulations build up BBHs as massive as 1000 solar masses within the lifetime of the AGN disk. BBHs formed in AGN disks will primarily have either low or negative effective spins.
- Secunda et al. (2021): BHs orbiting in an AGN disk may be orbiting in the retrograde direction (opposite to the direction of the gas disk). Gas drag acting on these orbiters leads to eccentricity pumping and semimajor axis decay. As a result, retrograde orbiters in AGN disks have the potential to become highly eccentric EMRIs. These retrograde orbiters may also act to ionize prograde orbiting BBHs depending on the mass of the SMBH.
- Gonglewski, Secunda, et al. (2026): This paper uses the N-body code in Secunda et al. (2019, 2020) to perform 360 simulations with over 1000 BHs each of the migration trap region of an AGN disk. We find that hierarchical BBH mergers in AGN disks can easily account for the higher total mass and uneven mass ratio mergers observed by LVK. We also provide predictions for intermediate mass black hole formation and intermediate mass ratio inspirals that will help us use future LISA data to measure the average lifetimes of AGN disks.

Swirling gas non-ideal MHD MRI experiment
Whether the magneto-rotational instability (MRI) can drive magnetic dynamo or accretion in proto-planetary disks remains an open question because of the combined non-ideal MHD effects of Ohmic resistivity, ambipolar diffusion, and the Hall effect. In Secunda et al. (2023a) we propose a swirling argon gas experiment that can be used to test our analytic and numerical theoretical predictions of the regimes in which MRI growth is possible. We present the results from a prototype un-magnetized experiment and make predictions and recommendations for a planned magnetized experiment.
Binary stars in the Epoch of Reionization
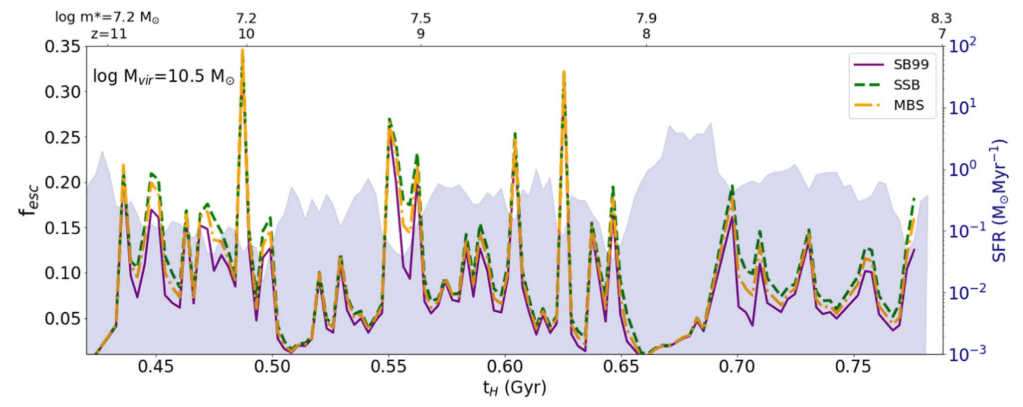
High-resolution numerical simulations of high redshift galaxies including feedback often assume stellar radiation based on single-stellar population synthesis models. However, strong evidence suggests the binary fraction of massive stars is >70%. Emission from binary stellar evolution will be harder than emission from single stars. The impact on the early Universe will be:
- Secunda et al. (2020b): Delayed ionizing photons from binary stellar evolution in high redshift galaxies can help to reionize the universe.
- Brezin, Secunda et al. (2021): SEDs of early galaxies with products of binary stellar evolution will have harder SEDs, but should still be distinguishable from SEDs of galaxies with Population III starts.

Studying substructure in the distant Milky Way stellar halo
Stars out beyond 100 kpc in the stellar halo of the Milky Way (MW) can be used to study more recent accretion events than in the outer halo and help map the MW’s gravitational potential out to the virial radius. In Sanderson, Secunda, et al. 2017, we generate mock surveys of the outer halo of 11 simulated MW-like galaxies mimicking present-day searches for distant M giants and projections for RR Lyra searches with LSST. We use these mock surveys to determine how the properties of these stars can be used to determine the merger history of the outer halo.
References
- Edelson, R., Gelbord, J., Cackett, E., et al., 2019, ApJ, 870,123.
- Hernández Santisteban, J. V., Edelson, R., Horne, K., et al. 2020, MNRAS, 498, 5399
- Jiang, Y.-F. 2022, ApJS, 263, 4
- Leitherer, C., Schaerer, D., Goldader, J. D., et al. 1999, ApJS, 123, 3
- Zu, Y., Kochanek, C.S., Kozlowski, S., & Peterson, B.M. 2016, ApJ, 819, 122
